|
Scissor Graphs all areas |
|
|
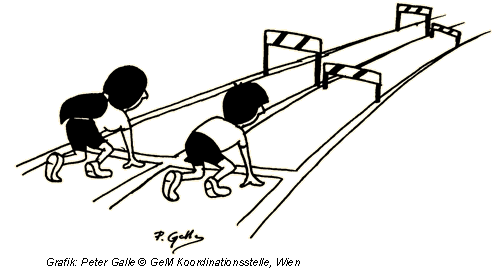
The following ilustration shows the relative share of Women (W) & Men (M) in a typical academic career in Portugal from 1997 to 2016.
Source: GPEARI/MCTES (Portugal) and She Figures reports (EU).
|
|
|
powered by QRandGO |
|